40+ WooCommerce Statistics and Trends in 2026: Market Share, Sales, and What’s Next

Share this content
Copy Link
Share



Design WooCommerce Stores That Convert
-
100+ Widgets
-
15+ Modules
-
150+ Templates
-
At Your Service
Follow us on:


WooCommerce still runs a bigger slice of the online-store world than any other tool. In 2026, roughly a third of all live ecommerce stores are built on it, and the plugin sits on top of WordPress, which powers close to 43% of the entire web.
That reach is the headline. The fuller story is more interesting: growth has flattened, competition has sharpened, and the numbers move depending on who is counting.
This roundup pulls the WooCommerce statistics and trends 2026 has produced so far, every figure traced to its source, so you can benchmark your store, plan a build, or settle an argument with real data instead of recycled claims.
Key WooCommerce Statistics at a Glance
Let’s take a look at the entire statistics for WooCommerce at a glance.
| Statistic | Figure | Source |
| Active WooCommerce stores | ~4.3 to 4.5 million | StoreLeads |
| Live sites detected running WooCommerce | ~6 million | BuiltWith |
| Active plugin installations | 7 million+ | WordPress.org |
| Store-count share of global ecommerce | 33.4% | StoreLeads |
| WordPress share of all websites | ~43% | W3Techs |
| Average cart abandonment rate | ~70% | Baymard Institute |
| Recoverable conversion lift from better checkout | up to 35.26% | Baymard Institute |
| US ecommerce share of Q4 retail | 16.6% | US Census Bureau |
| Mobile share of global ecommerce sales | ~60% | Statista |
| Shoppers who expect personalized experiences | 71% | McKinsey |
WooCommerce Market Share Statistics 2026
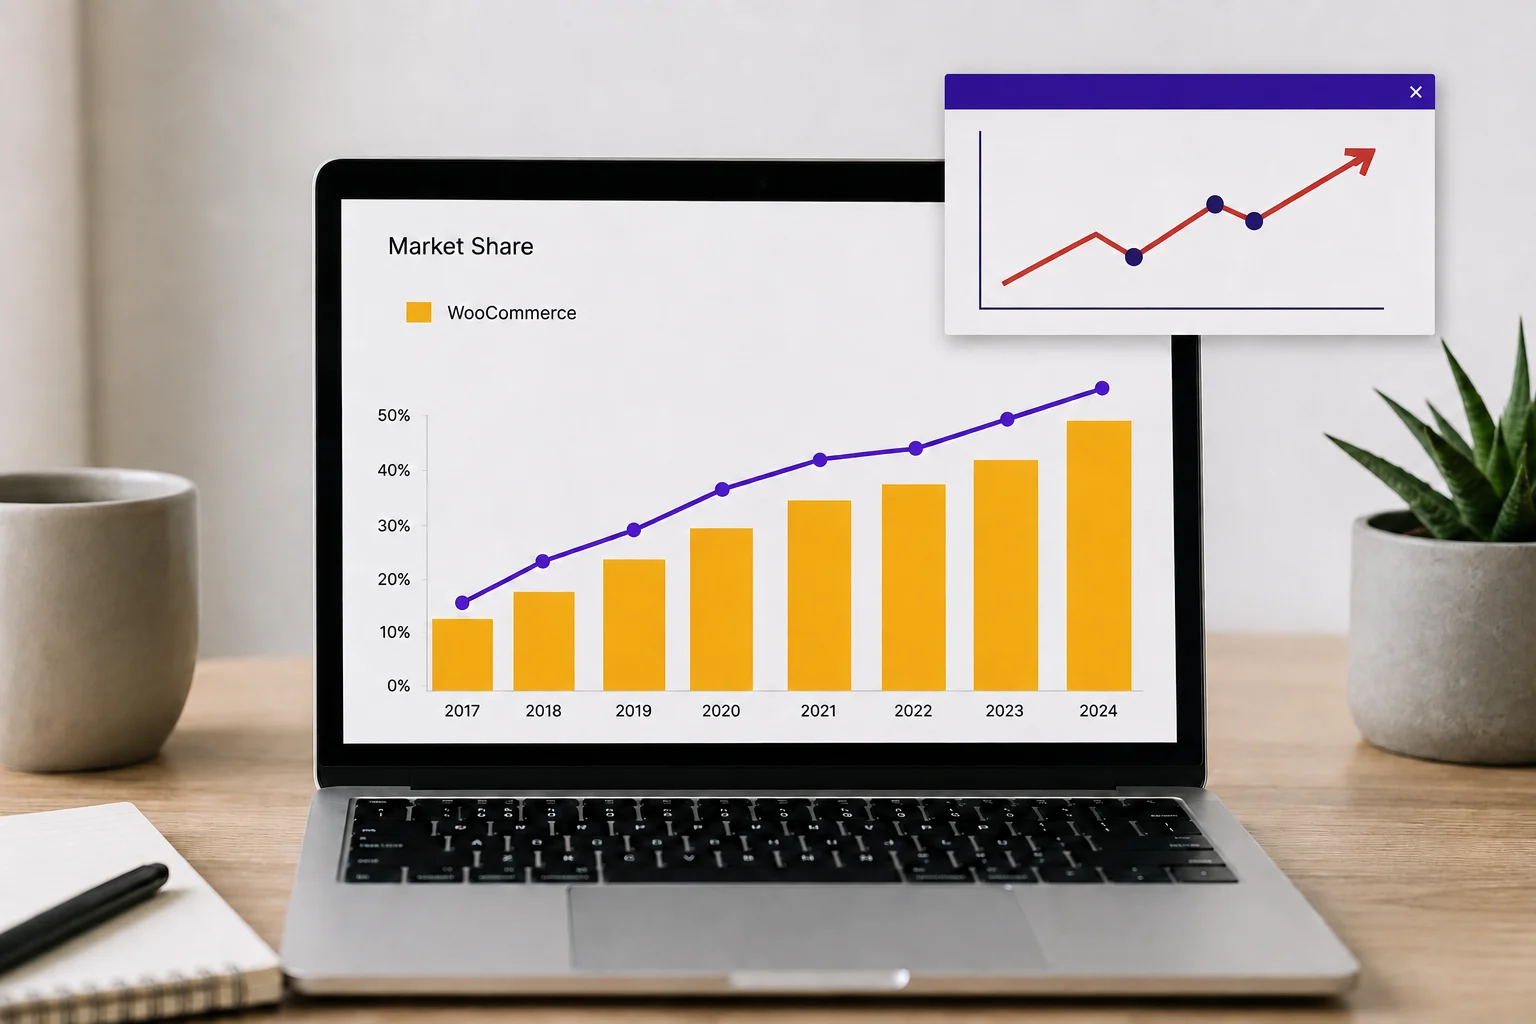
Start with the number everyone argues about: market share. WooCommerce leads the ecommerce field by raw store count, but the exact figure swings based on what each tracker measures.
- ~4.3 to 4.5 million active stores. StoreLeads tracks live storefronts across more than 13 million sites and puts WooCommerce at the top of the list.
- 33.4% of the global ecommerce market by store count. That is also a StoreLeads figure, and it is the cleanest measure of active selling stores.
- ~6 million live sites detected. BuiltWith scans for code signatures, so its count runs higher than active-store numbers because it catches installs that are not operating as full shops.
- 7 million+ active plugin installations. The WordPress.org plugin directory reports installs, which is different from live stores.
- Over 450+ million lifetime downloads. Also from WordPress.org, this reflects the plugin’s long history since its 2011 launch.
Why the numbers never quite match
Here is the part most roundups skip. Four trackers, four definitions, four different totals. StoreLeads counts live storefronts. BuiltWith detects technology footprints. W3Techs measures usage across the web. WordPress.org counts plugin installs. None of them is wrong. They are answering different questions.
The practical rule: when you cite a WooCommerce market-share figure, name the source and the definition in the same breath. A store owner benchmarking against active competitors wants the StoreLeads live-store number. A developer sizing a plugin market wants installs. Mixing them is how bad stats spread.
WooCommerce vs Shopify by store count and traffic
WooCommerce wins on volume. Shopify wins at the top of the market. Both can be true at once.
- Across the broad web, WooCommerce leads by store count with its 33.4% share.
- Among the top one million ecommerce sites, the ranking flips. Shopify appears on roughly 28.8% of them versus WooCommerce at about 18.2%, per BuiltWith data. Higher-traffic, higher-revenue brands skew toward hosted platforms.
- WooCommerce’s estimated gross merchandise volume sits around $30 to 35 billion a year. Treat that as an industry estimate, not a hard primary figure, since no single authority publishes it.
The takeaway is not “which platform is better.” It is where each one concentrates. WooCommerce owns the long tail of small and mid-size stores. Shopify pulls ahead among the largest merchants.
Historical WooCommerce Statistics
WooCommerce did not start as the giant it is today. It began as a theme-shop side project and grew into the backbone of WordPress ecommerce over about fifteen years.
- Launched on September 27, 2011. WooCommerce shipped as a plugin from WooThemes, built by Mark Forrester, Magnus Jepson, and Adii Pienaar, forked from an earlier ecommerce project. (WooCommerce)
- 1 million downloads by mid 2013, under two years after launch, then 4 million by August 2014. The early climb was steep.
- 7 million downloads by 2015, just before Automattic, the company behind WordPress.com, acquired WooThemes in May 2015. (WooCommerce) The team of 55 was Automattic’s largest acquisition at the time.
- Storefront, the first official theme, arrived in November 2014, and the brand shortened to “Woo” in 2023.
- Now past 340 million lifetime downloads and more than 7 million active installations, per WordPress.org.
- Live stores peaked near 4.75 million in late 2024, according to StoreLeads, and have settled slightly below that since.
That arc matters when you read any single-year figure. WooCommerce is not a young challenger anymore. It is established infrastructure, which changes how you weigh its stability, its ecosystem, and its staying power.
The WordPress Ecosystem WooCommerce Runs On
WooCommerce does not exist in a vacuum. Its fortunes are tied to WordPress, and WordPress is still the giant of the web.
- ~43% of all websites run on WordPress, and it holds close to 60% of the CMS market, according to W3Techs. Shopify trails around 5% and Wix around 4%, which puts WordPress miles ahead on raw reach.
- WooCommerce appears on roughly a fifth of all WordPress sites. When people say a third of the internet’s online shops run on WordPress, this is the plugin doing that work.
- Elementor Pro runs alongside WooCommerce on about 1.24 million sites, per BuiltWith. That overlap matters. A huge share of store owners are already designing with Elementor, which is exactly why no-code WooCommerce customization has become such a busy space.
What does a maturing platform mean for you? The plateau is not a decline. WooCommerce moved out of hyper-growth and into a large replacement-and-optimization market. For store owners and agencies, that shift rewards a different skill set.
Winning now is less about riding a wave of new installs and more about squeezing more revenue out of the traffic and stores that already exist. That is where checkout, speed, and design earn their keep.
WooCommerce Themes and Plugins Statistics
Part of why WooCommerce stuck around is the ecosystem stacked on top of it. The plugin and theme catalog around WordPress is huge, and a large slice of it exists to extend stores.
- More than 60,000 free plugins sit in the WordPress.org directory, and premium marketplaces push the real total past 70,000.
- Roughly 14,000 free themes live in the WordPress.org theme directory. Add premium marketplaces like ThemeForest and the total clears 30,000.
- Elementor has passed 10 million active installations and runs on close to a third of all WordPress sites, per W3Techs. It is the most widely used page builder by a wide margin.
- Elementor and WooCommerce overlap on about 1.24 million sites, according to BuiltWith. That single number explains why no-code WooCommerce design has become such a crowded category.
- WooCommerce itself runs on roughly a fifth of all WordPress sites. For a plugin that started as a theme-shop side project, that footprint is striking.
Here is the honest tradeoff. That much choice is a gift and a liability at once. You can build almost anything, but every extra plugin is another dependency to maintain, update, and secure. Which leads straight to the next set of numbers.
Security Statistics

Security is the part of the stats picture most store owners would rather skip. The data says they should not.
- 11,334 new vulnerabilities were found across the WordPress ecosystem in 2025, a 42% jump over the year before, according to Patchstack, the leading WordPress vulnerability tracker.
- 91% of those vulnerabilities sat in plugins, 9% in themes, and only six in WordPress core, all rated low risk. The core software is not the weak point. The extensions are.
- About 46% had no patch available when they went public. Waiting for an update is not always an option, because sometimes there is not one yet.
- The most-targeted flaws get exploited within roughly five hours of disclosure, and about half of the high-impact ones within 24 hours (Patchstack). Response speed is everything.
- Hosting and firewall defenses blocked only around 12% of actively exploited vulnerabilities in Patchstack’s testing. Set-and-forget security is a myth.
- Premium plugins are not automatically safer. Patchstack found that paid components carried three times more known-exploited vulnerabilities than free ones, partly because closed code gets less outside review.
What does this mean for a WooCommerce store? A shop runs more plugins than a simple blog, so its exposure is naturally higher. The practical defense is unglamorous: keep everything updated, remove plugins you do not use, and favor actively maintained tools over abandoned ones. Fewer moving parts, fewer doors to lock.
WooCommerce Checkout and Cart Statistics Every Store Owner Should Know
Why do most carts never turn into orders? Because checkout is where good intentions go to die, and the data on this is brutal.
- About 70% of carts are abandoned. Baymard Institute calculates a 70.19% average across roughly 49 separate studies, the most reliable benchmark available. For every ten shoppers who add to cart, seven leave.
- Unexpected costs are the top reason. Surprise shipping, taxes, and fees at the final step push a large share of shoppers away. Forced account creation and long, clumsy forms follow close behind.
- Fixing checkout UX can lift conversions by up to 35.26%. Baymard’s decade of testing found that recoverable figure, which across US and EU ecommerce translates to an estimated $260 billion in orders left on the table.
Not all of that 70% is recoverable. Baymard estimates even a well-optimized checkout floors out around 55 to 60%, since a share of shoppers are only ever browsing. The rest is yours to win back.
Read that last number again. The problem is enormous, and most of it is self-inflicted through checkout design nobody optimized. A default WooCommerce checkout is functional, but functional is not the same as persuasive.
Trimming fields, showing costs early, and building a layout that guides the eye can move the needle more than another ad campaign. This is the practical case for tools that let you customize your WooCommerce checkout without touching code, so testing a cleaner flow takes an afternoon rather than a developer sprint.
The same logic applies when you redesign your cart page to reduce friction before shoppers even reach payment.
Mobile Commerce Statistics for WooCommerce Stores
If your store still treats mobile as an afterthought, the numbers say you are optimizing for the minority.
- Mobile drives roughly 60% of global ecommerce sales, according to Statista, and its share keeps climbing toward a projected 63% by 2028.
- Mobile abandonment runs far higher than desktop. Tracking from Dynamic Yield puts mobile cart abandonment around 80% against roughly 66% on desktop. Smaller screens, slower loads, and fiddly forms all take a toll.
- Mobile pulls in about three-quarters of ecommerce traffic but converts at a lower rate than desktop. That traffic-to-conversion gap is one of the defining problems in ecommerce right now.
Zoom out to the whole retail picture, and the direction is steady. US ecommerce reached 16.6% of total retail sales in Q4 2025, per the US Census Bureau, and online sales grew 5.3% year over year while total retail sales grew just 2.7%. Online keeps taking share, and mobile is doing most of the taking. A store that reads well on a phone, loads fast, and checks out in a few taps is no longer a nice extra. It tends to be the difference between a sale and a bounce. A cleaner, faster shop page pulls its weight here, too.
Performance Metrics Statistics

Would you wait four seconds for a page to load before buying? Neither will your customers. Performance is where store speed turns straight into revenue, and the research here is unusually consistent.
- A 0.1-second improvement in mobile load time lifted retail conversions by 8.4% and average order value by 9.2%, per Google and Deloitte’s Milliseconds Make Millions study of 37 brands. A tenth of a second, real money.
- Pages loading in about two seconds convert far better than slower ones. Portent’s research put conversion rates roughly 50% higher at under two seconds versus three to four seconds.
- As load time climbs from one to three seconds, the chance of a bounce rises 32%, according to Google. From one to five seconds it jumps 90%.
- 53% of mobile visitors abandon a page that takes longer than three seconds to load (Google). On mobile, patience is thin.
- Every 100 milliseconds of latency cost Amazon about 1% in sales, a finding echoed by Walmart, which saw conversions rise 2% for each one-second speed gain.
The pattern is hard to argue with. Speed is not a vanity metric. It is one of the cheapest conversion levers a store has, and most WooCommerce sites, weighed down by heavy themes and stacked plugins, run slower than their owners think. Measuring your real load time on an actual phone is the first honest step.
WooCommerce Trends to Watch in 2026

Beyond the headline stats, a few shifts are reshaping how WooCommerce stores get built and how shoppers buy. These are the WooCommerce trends 2026 has put front and center.
AI and agentic commerce
AI has moved past basic product suggestions. Shoppers now research, compare, and sometimes complete purchases with AI assistants in the loop, which changes how products need to be described and structured. Clean product data, rich metadata, and fast pages are becoming as important for AI-driven discovery as traditional SEO ever was.
Hyper-personalization as the default
Generic storefronts are wearing thin. McKinsey found that 71% of consumers expect personalized interactions and 76% get frustrated when they do not get them. The same research found that companies who get personalization right pull in 40% more revenue from those efforts than average players.
For a WooCommerce store, that means tailored recommendations, smarter email, and messaging that reflects who the shopper actually is. Personalized WooCommerce email customization is one of the more direct ways smaller stores close the gap with big-budget brands.
Block-based checkout and HPOS
WooCommerce keeps modernizing under the hood. High-Performance Order Storage moves order data into dedicated tables built for scale, which helps busy stores stay quick. The block-based checkout changes how themes and extensions hook in, and it nudges the whole ecosystem toward faster, more flexible purchase flows.
Headless, subscriptions, and social commerce
Headless builds are moving from experiment to mainstream for stores that want total control over the front end. Subscriptions keep expanding as merchants chase recurring revenue and higher lifetime value. Social commerce, most of it happening on phones, is folding discovery and checkout into a single scroll. None of these is a fringe idea anymore. Each is a live pressure on how stores are designed.
What the 2026 Data Means for WooCommerce Store Owners
Read across these numbers and one theme keeps surfacing. The WooCommerce market has moved from chasing new installs to getting more out of the stores that already exist. That reframes what actually pays off this year.
Benchmark against your niche, not the headline. The 70% abandonment average hides wide swings by category, price point, and device. A fashion store and a B2B parts supplier should not measure themselves against the same line. Pull your own numbers first, then compare.
Treat checkout and cart as revenue projects, not settings pages. The single biggest documented upside on this page, north of 35%, sits behind design work most stores never schedule. You do not need a rebuild. You need to test one friction point at a time and keep what wins.
Build for the phone as the primary screen. When mobile drives most of your sales and most of your abandoned carts, the mobile experience is not a version of your store. It is your store. Speed, layout, and a short checkout carry more weight there than anywhere else.
The Bottom Line
The data tells a clear story for 2026. This is a mature, still-dominant platform rather than a rising or falling one, so the advantage goes to store owners who optimize rather than wait for a growth wave. Checkout is the single biggest lever most stores are ignoring, with a documented conversion upside north of 35% sitting behind better design. And mobile is no longer a channel to plan around later, since it already drives the majority of sales and the bulk of abandoned carts.
Pick one number from this page that stings a little, then go fix the thing behind it. Which stat describes your store right now, and what would it take to move it this quarter?
WooCommerce Statistics FAQ
What is WooCommerce’s market share in 2026?
It depends on the measurement. By active store count, WooCommerce holds about 33.4% of the global ecommerce market, per StoreLeads. By share of all websites, W3Techs puts it near 8.7%. Both are accurate within their own methods, which is why you see such different figures quoted.
Is WooCommerce still growing?
Growth has flattened rather than reversed. WooCommerce peaked at roughly 4.15 million live stores in mid-2026 (Q2) and now sits slightly below that level, according to StoreLeads. The better description is a mature, stable market rather than a declining one, with plenty of room in optimization and replacement rather than raw expansion.
How many WooCommerce stores are there?
Around 4.3 to 4.5 million active stores by StoreLeads’ live-store count. BuiltWith detects closer to 6 million sites running WooCommerce technology, and WordPress.org reports more than 7 million active plugin installations. The gap comes down to active stores versus installs versus technology detections.
Why do WooCommerce market-share numbers vary so much?
Because each tracker counts something different. StoreLeads measures live storefronts, BuiltWith detects code footprints, W3Techs measures web usage share, and WordPress.org counts installs. When you compare figures, always check which of those four you are looking at.